
Recommended tools
Recommended tools to get you started with DataDirect.
Reminder: DataDirect is a database connection PostgreSQL. Therefore, any tool that works with databases, should work with DataDirect out-of-the-box.
We understand that the universe of tools available can be overwhelming, especially for beginners. Therefore, we've curated a list of tools we use internally to get you started.
Reference links: Note that the screenshots and hyperlinks were up-to-date at the time this article was created. Hence, you might notice differences when using the tools mentioned below.
Retrieving your credentials with Postman
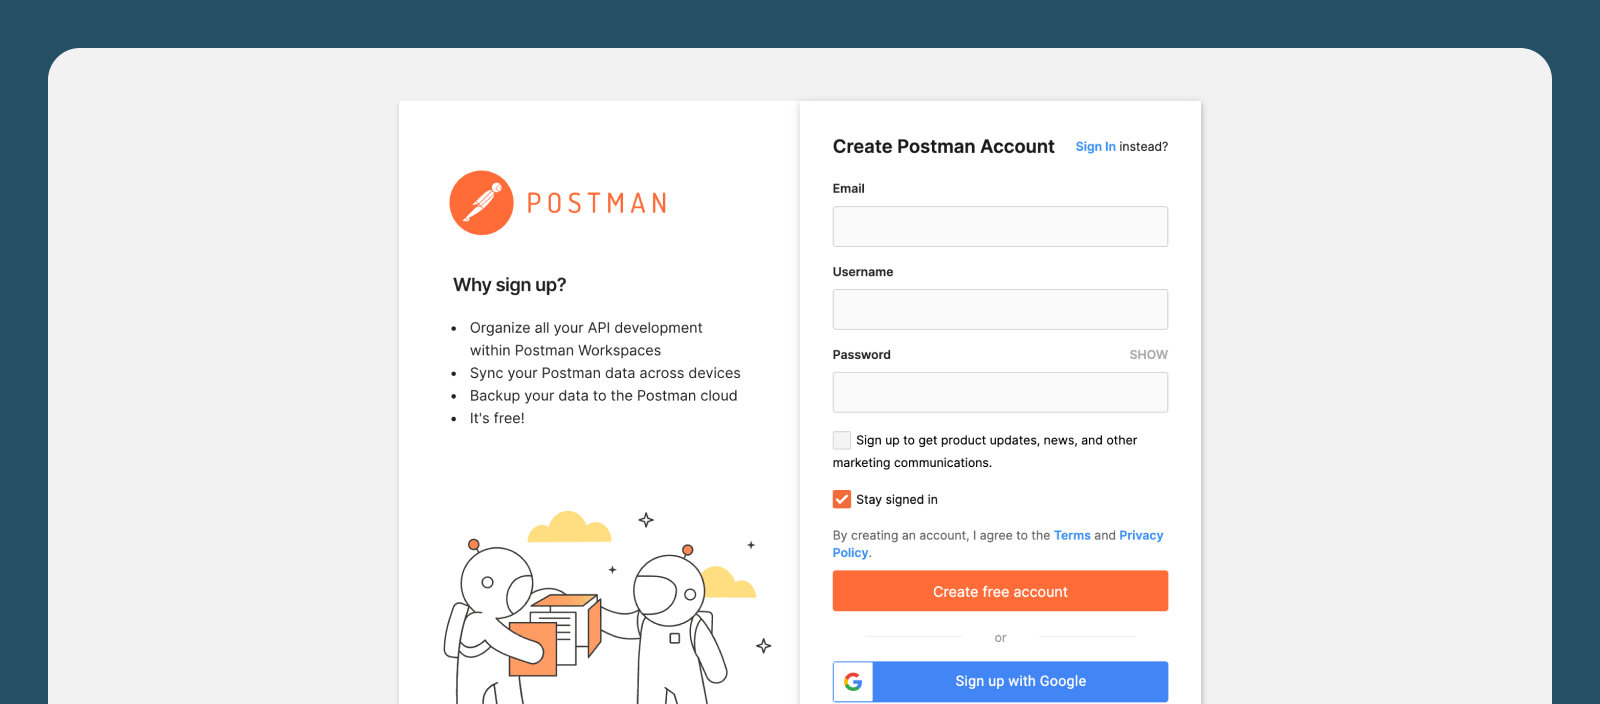
The best way to get your database connection information is through our API, which is safe and reliable. If dealing with APIs seems complicated, there's a user-friendly tool called Postman that can make it easier.
This brief guide assumes you're starting from scratch and aims to help you along the way.
Sign up for an account.
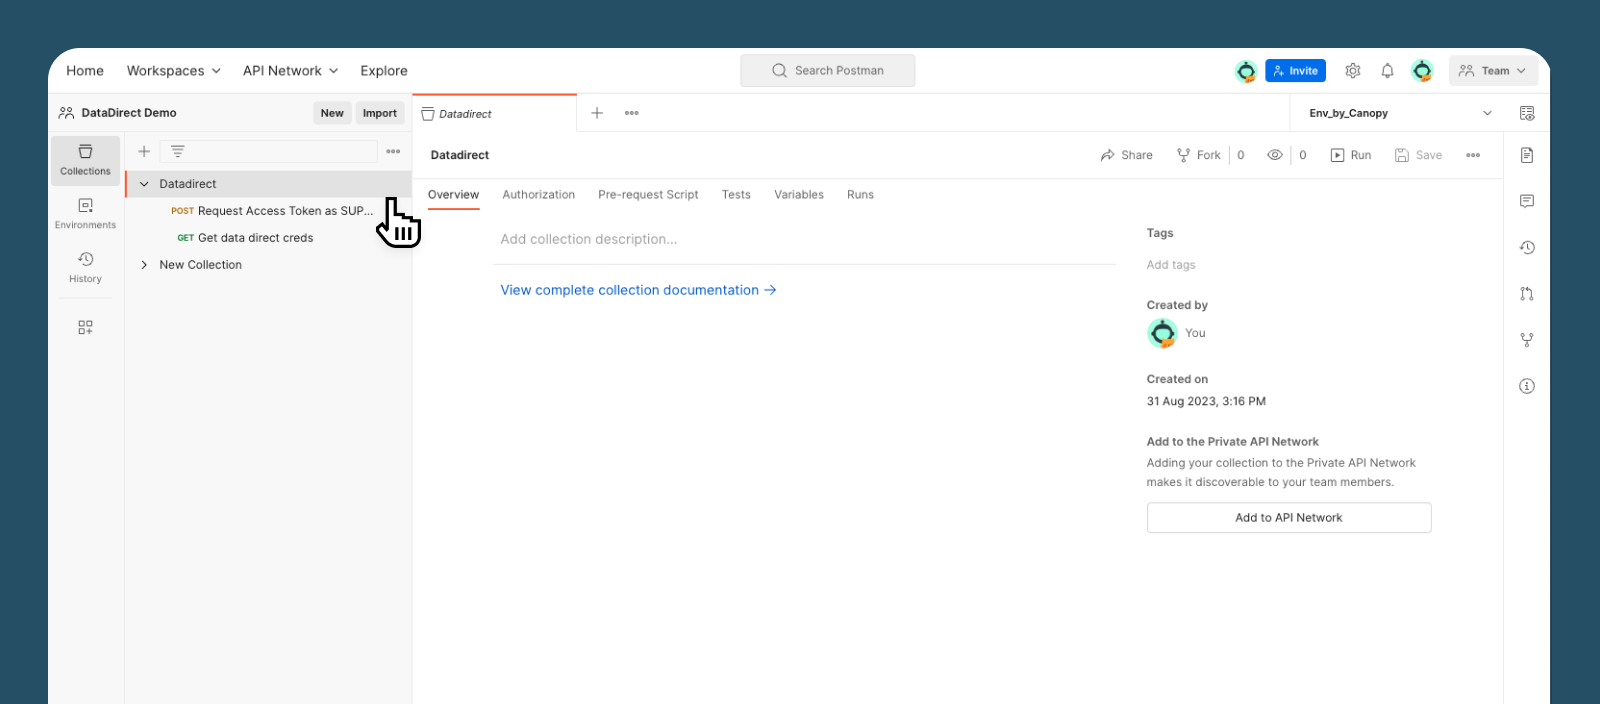
Join a Workspace created by Canopy
You will be in your default personal Workspace. It's a place for you to add API requests for your personal projects. However, this time you would need to join a Workspace created by Canopy.
This should already have 2 API requests pre-written for you ("POST Request Access Token..." and "GET Get DataDirect credentials").
If you don't have access to the workspace yet and/or would like to get an invitation, reach out to us.
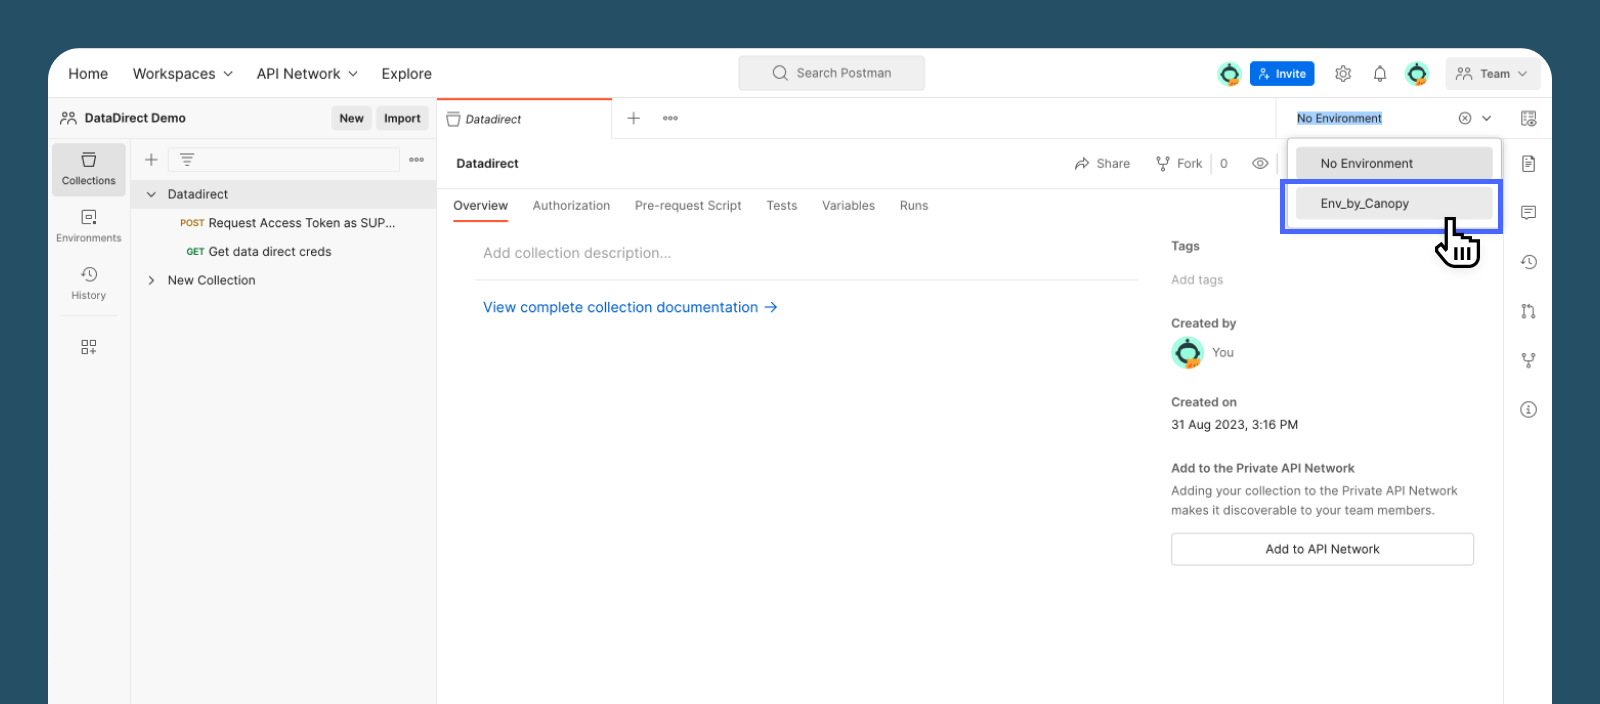
Make sure your Environment is set to "Env_by_Canopy"
It should have the variables needed (e.g. client_id, client_secret etc.) set up for your environment (UAT, Prod or Demo).
If you skip this step, you might be unable to make requests.
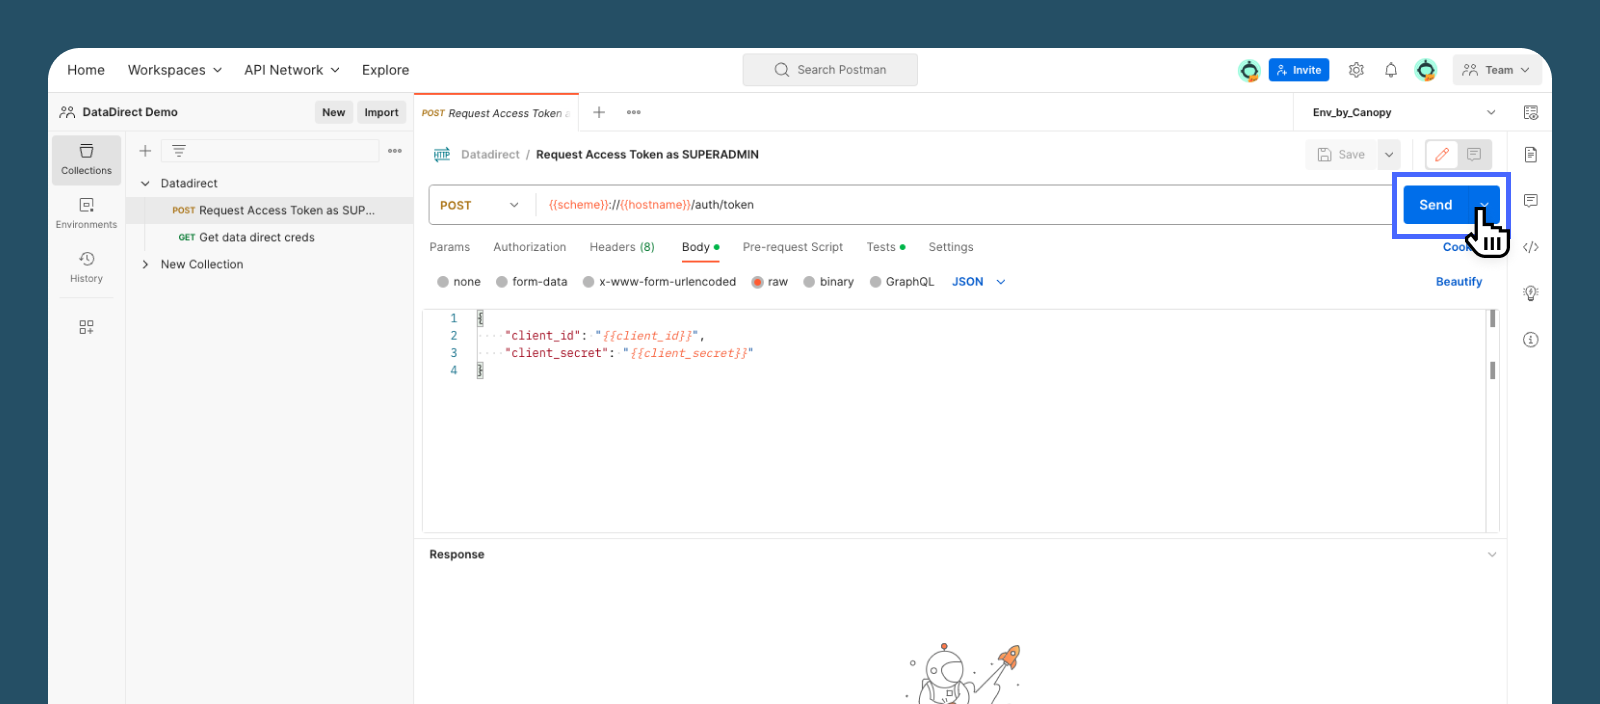
Make the first call included in the collection -POST "Request Access Token"
POST "Request Access Token"This should authenticate you in our system to make any follow-up API calls.
Make the second call included in the collection - GET request "Get DataDirect credentials"
GET request "Get DataDirect credentials"This should retrieve your database connection details.
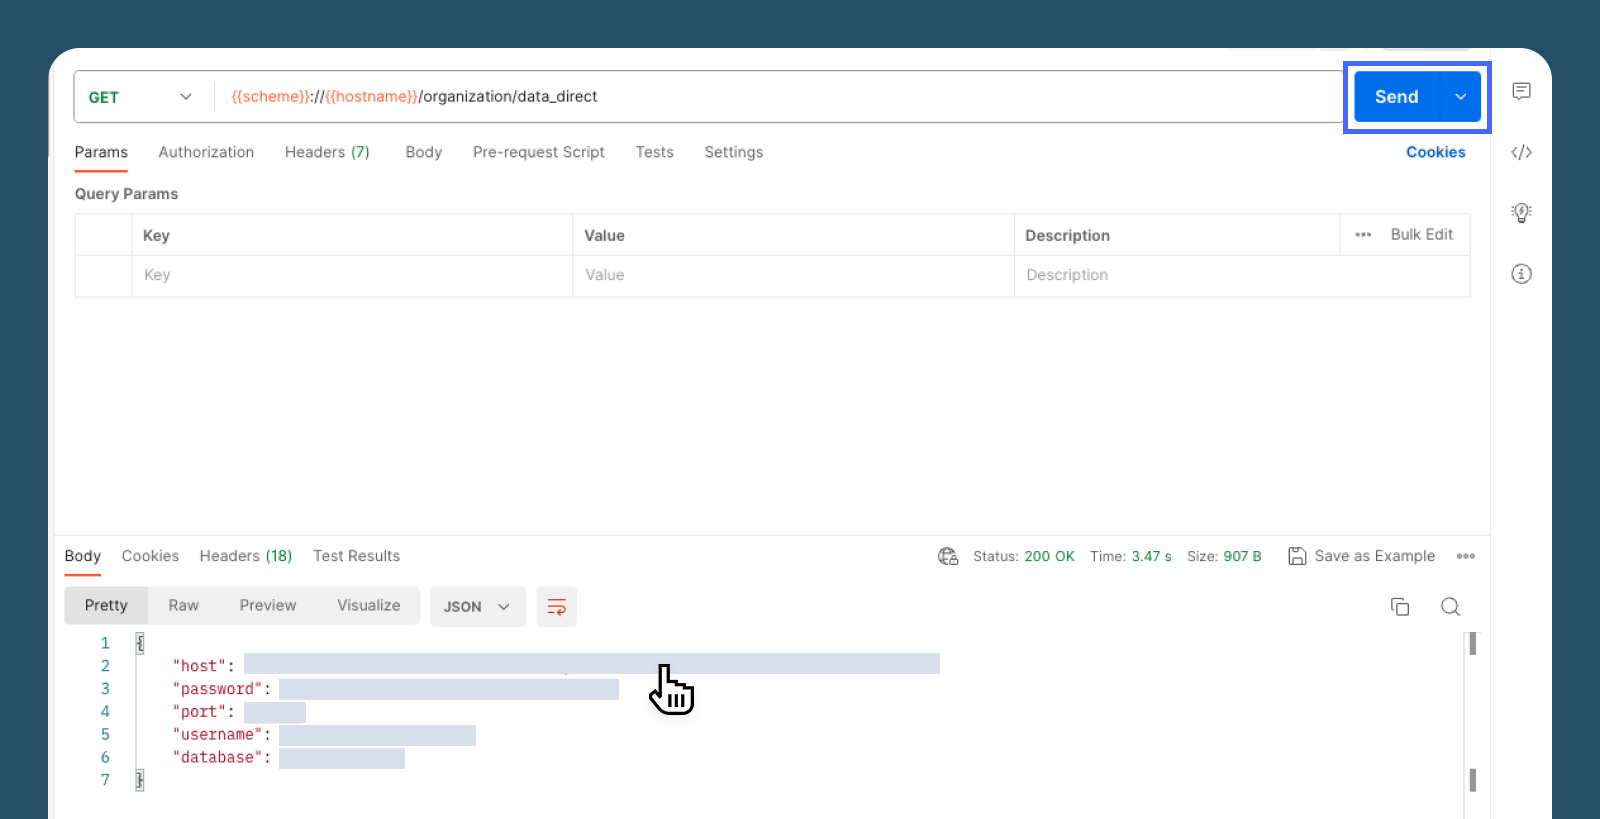
Copy-paste the connection details to your tool of choice
You now have access to DataDirect!
Creating your first report with Trevor
Now that you have your DataDirect details, you might be interested in getting answers to business questions using Canopy data.
When it comes to Business Intelligence tooling there is a range of preferences to take into account:
- How technical you are
- Preference for open-source or proprietary software
- Individual SaaS license or shared enterprise license
After much internal debate, our recommended tool is Trevor.io due to how user-friendly it is to non-technical users. I.e. you don't have to know SQL to build reports and answer questions using your data.
Plus, it is Free and quick to get started and allows for creating graphs/ dashboards out-of-the-box.
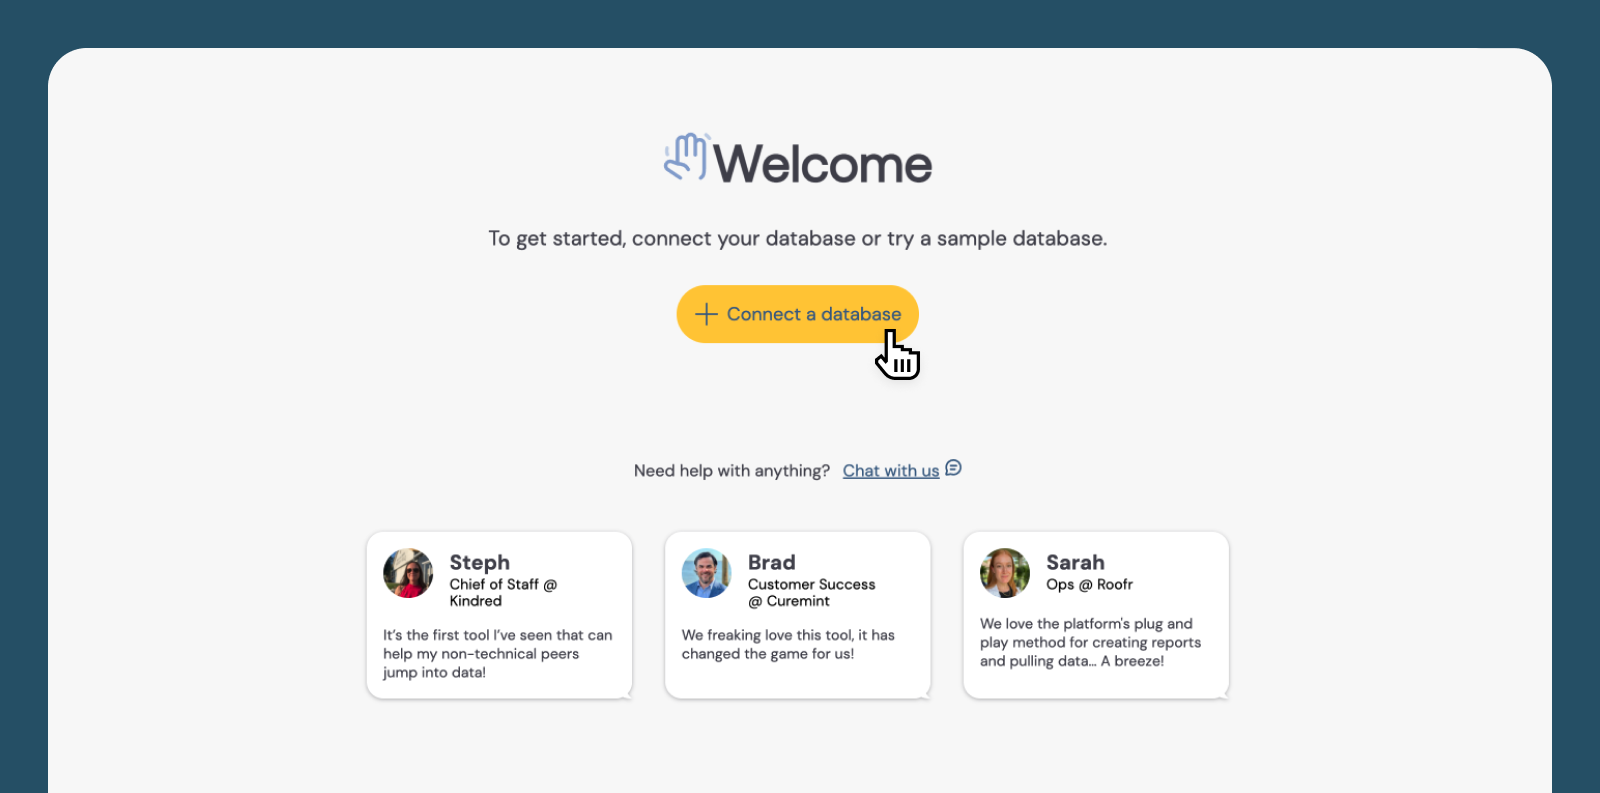
This quick guide assumes you are starting from scratch.
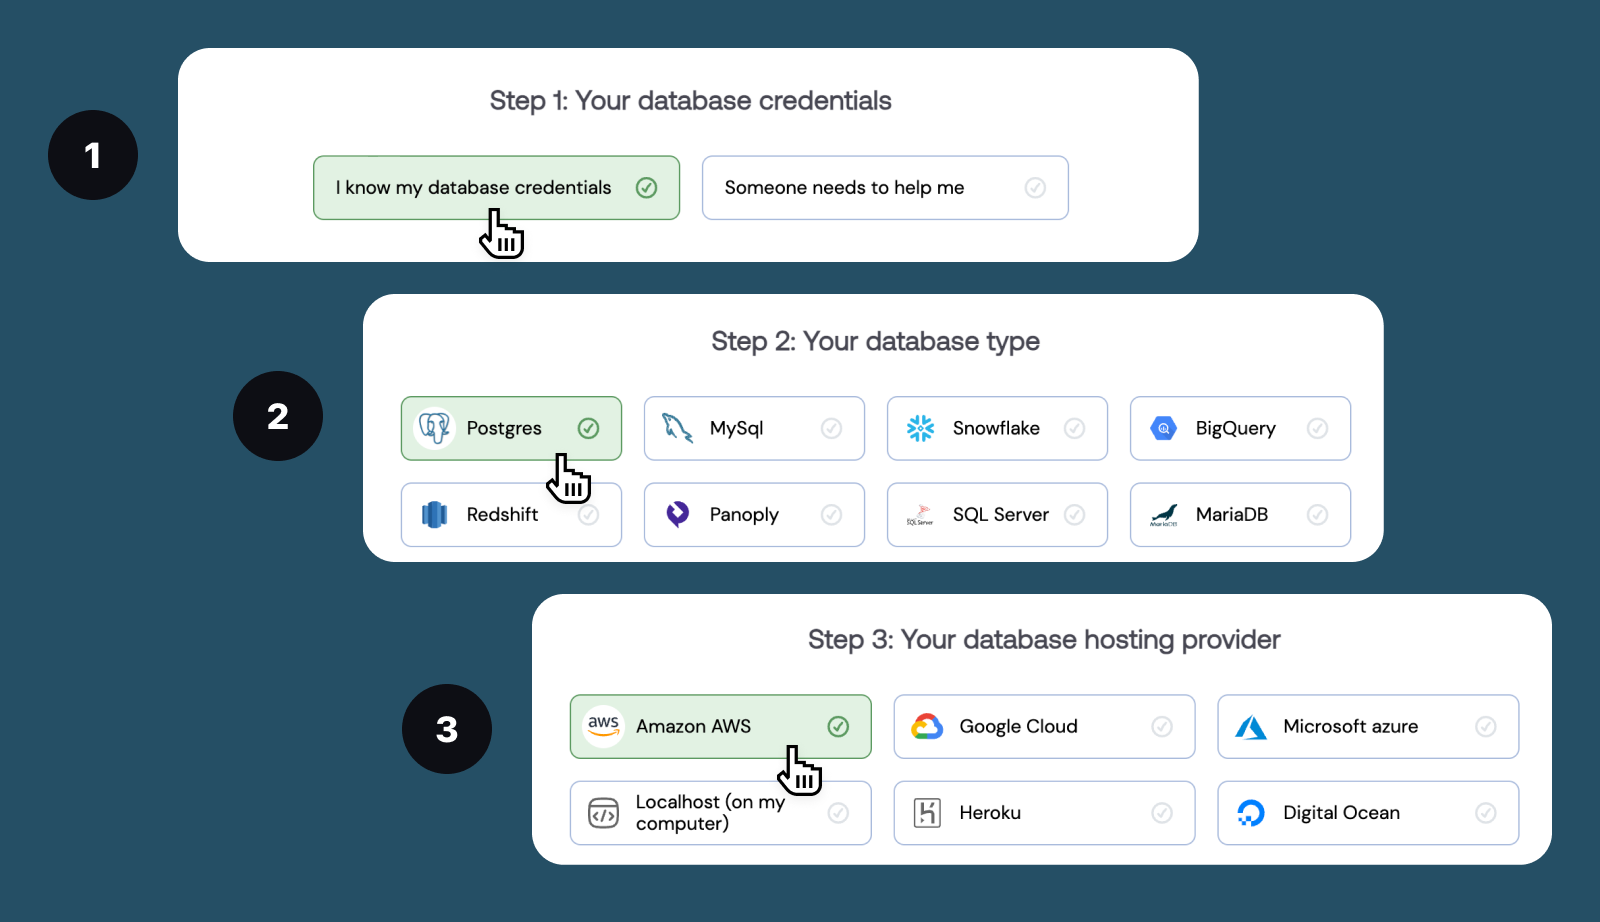
Sign up for an account and Go through their connection setup flow.
- Choose "I know my database credentials" for Step 1.
- Select "Postgres" during Step 2.
- Pick "Amazon AWS" whilst on Step 3.
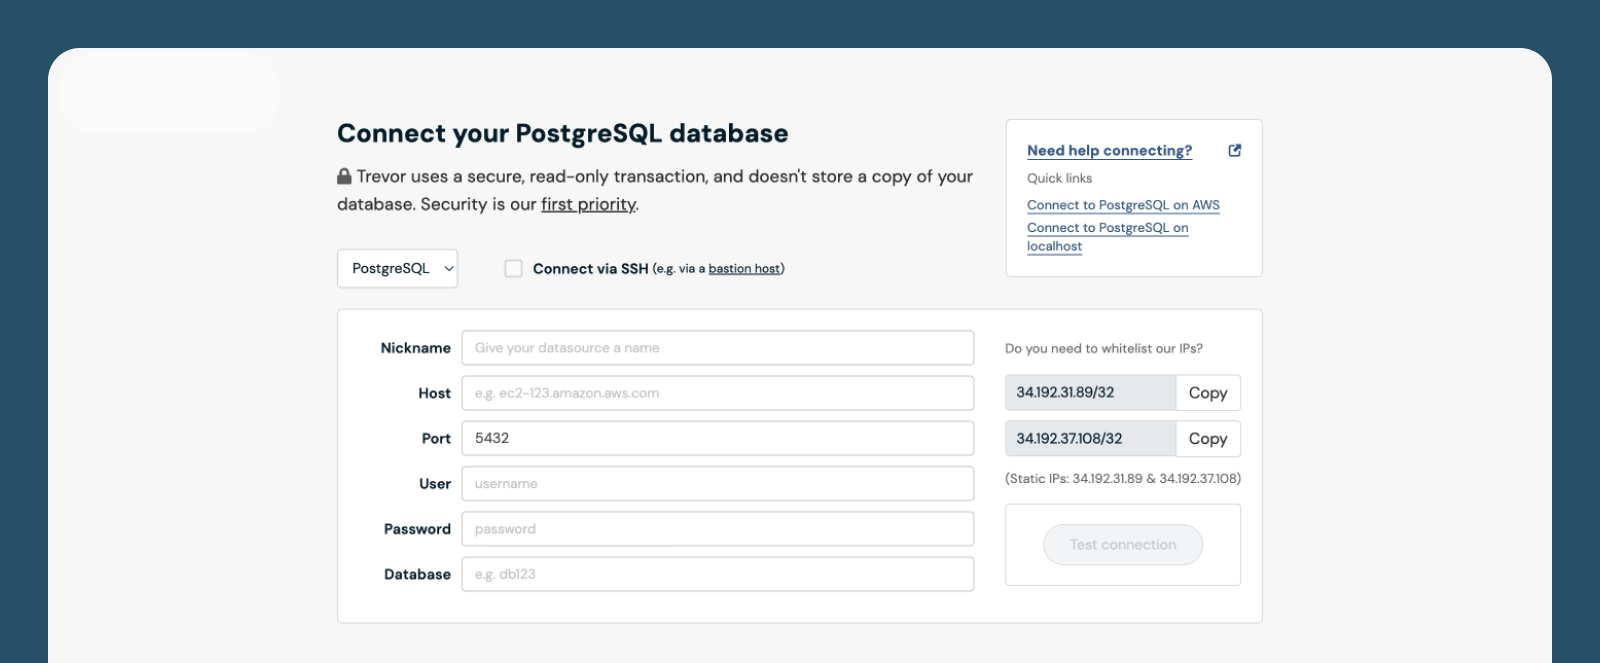
Input DataDirect details.
See our guide on Postman at the top of the page to get help with retrieving those.
Click "Test connection", then "Continue".
Let's go through an exampleWe are going to get an answer to "How many accounts created in August 2023 are there for each status type?"
Build your first query.
Start by choosing a table that has the data you need.
First, let's choose a table to start from - "Accounts" for example.
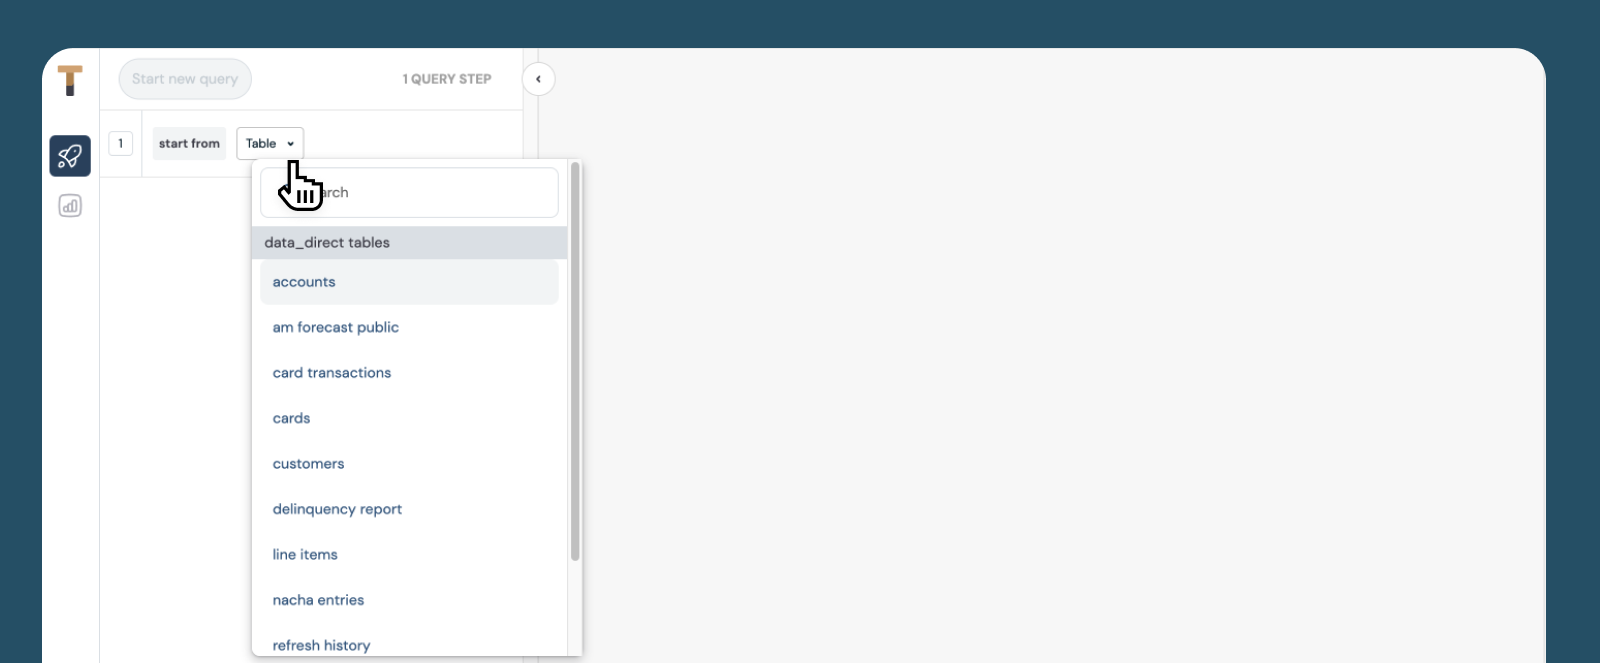
What are all of the tables are available?To get familiar with tables in DataDirect, we recommend starting from Data Direct Tables.
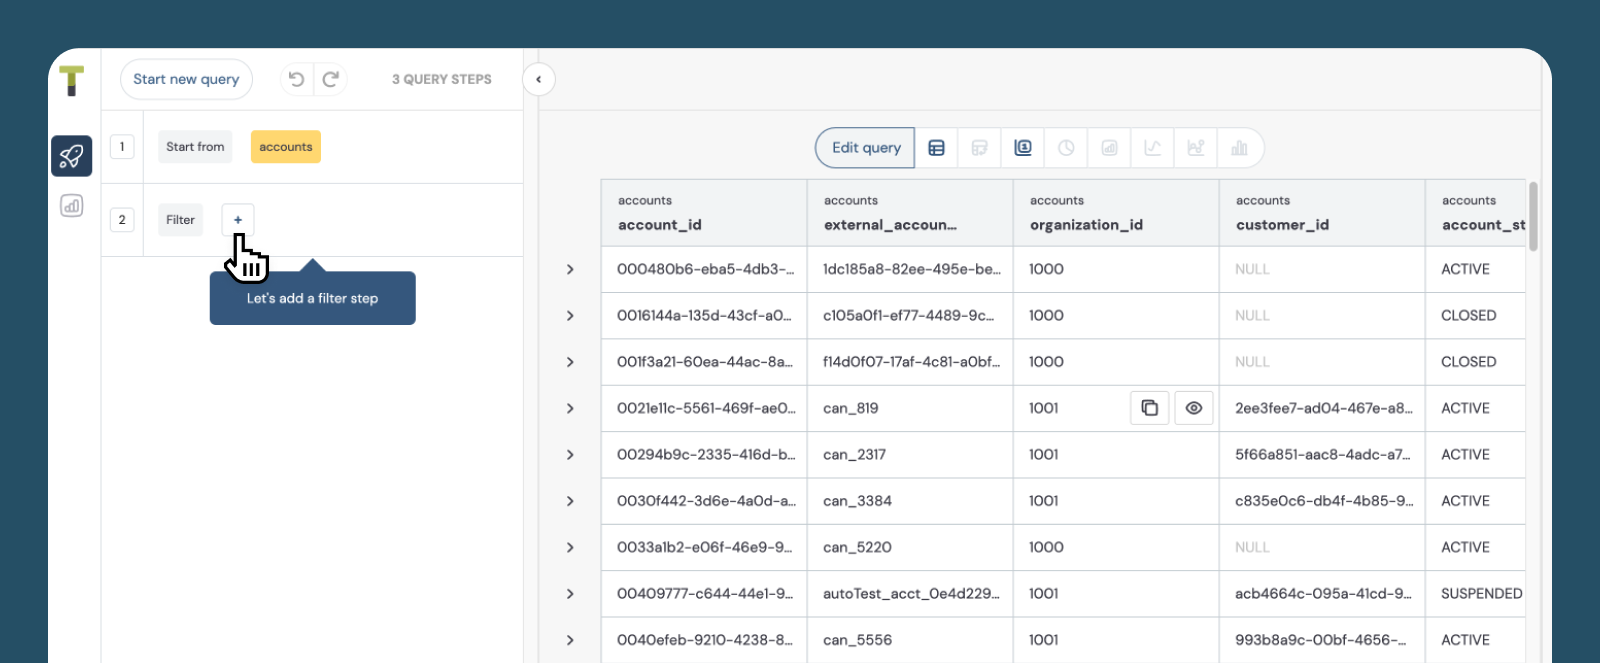
By default, choosing a table in Trevor shows you all of the Columns and data available in the table.
Apply some filters
This step requires familiarity with columns.
In this example, we are looking to find a column that shows when an account was opened in the system.
What do the column mean?All of our columns follow the API schema. That means our API reference should have the answers.
E.g. to understand what a column in the Accounts table means, you need to navigate to a corresponding GET request inside out API Reference docs - Get a specific Account .
Then click under "RESPONSES" - 200 (which is a code for a successful API call).
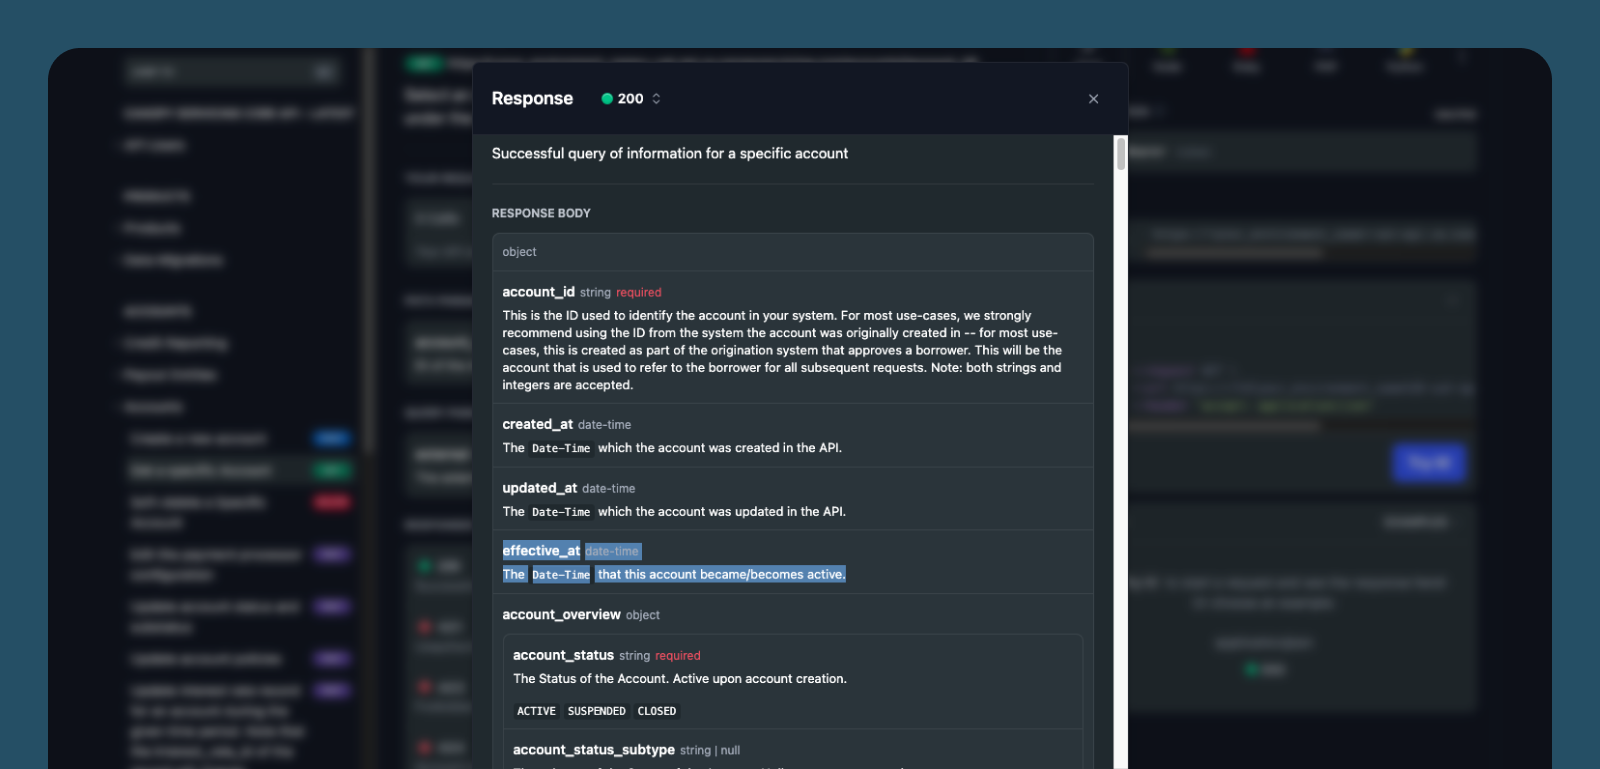
Thus, we identify that Effective_at column is the one we want to filter by.
Specifically, we are looking for accounts opened in August 2023. Hence, the effective_at value should be between 2023-07-31 and 2023-09-01.
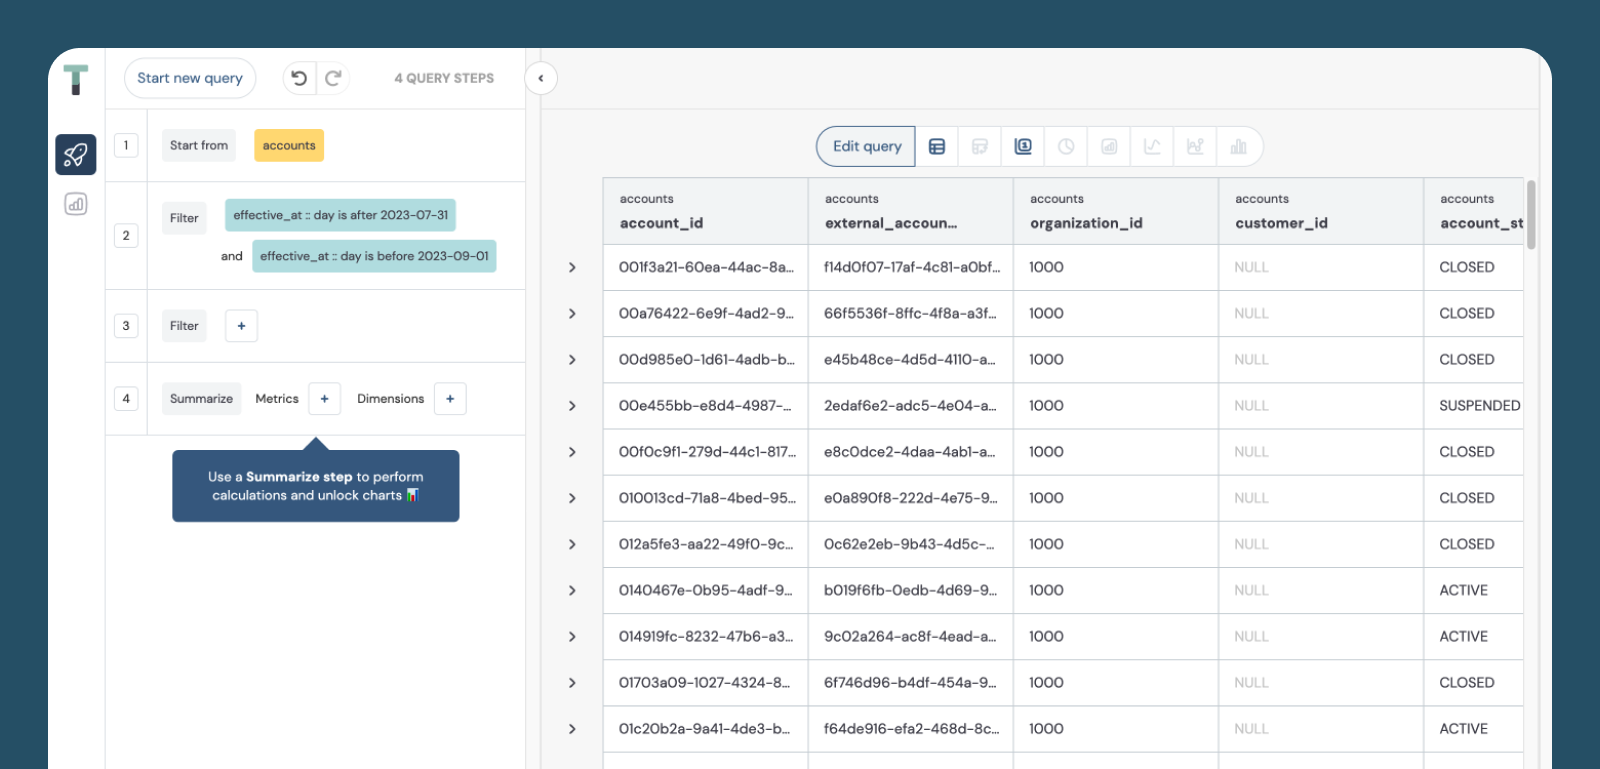
Summarize results
Now that we have all accounts opened in Aug 2023, we need to count all of them grouped by different account statuses (Active, Suspended etc.) and status sub-types (Delinquent, Charge-off etc.).
We will start by choosing Dimensions [i.e. columns to group by]. In this case, we need account_status, and account_status_subtype columns.
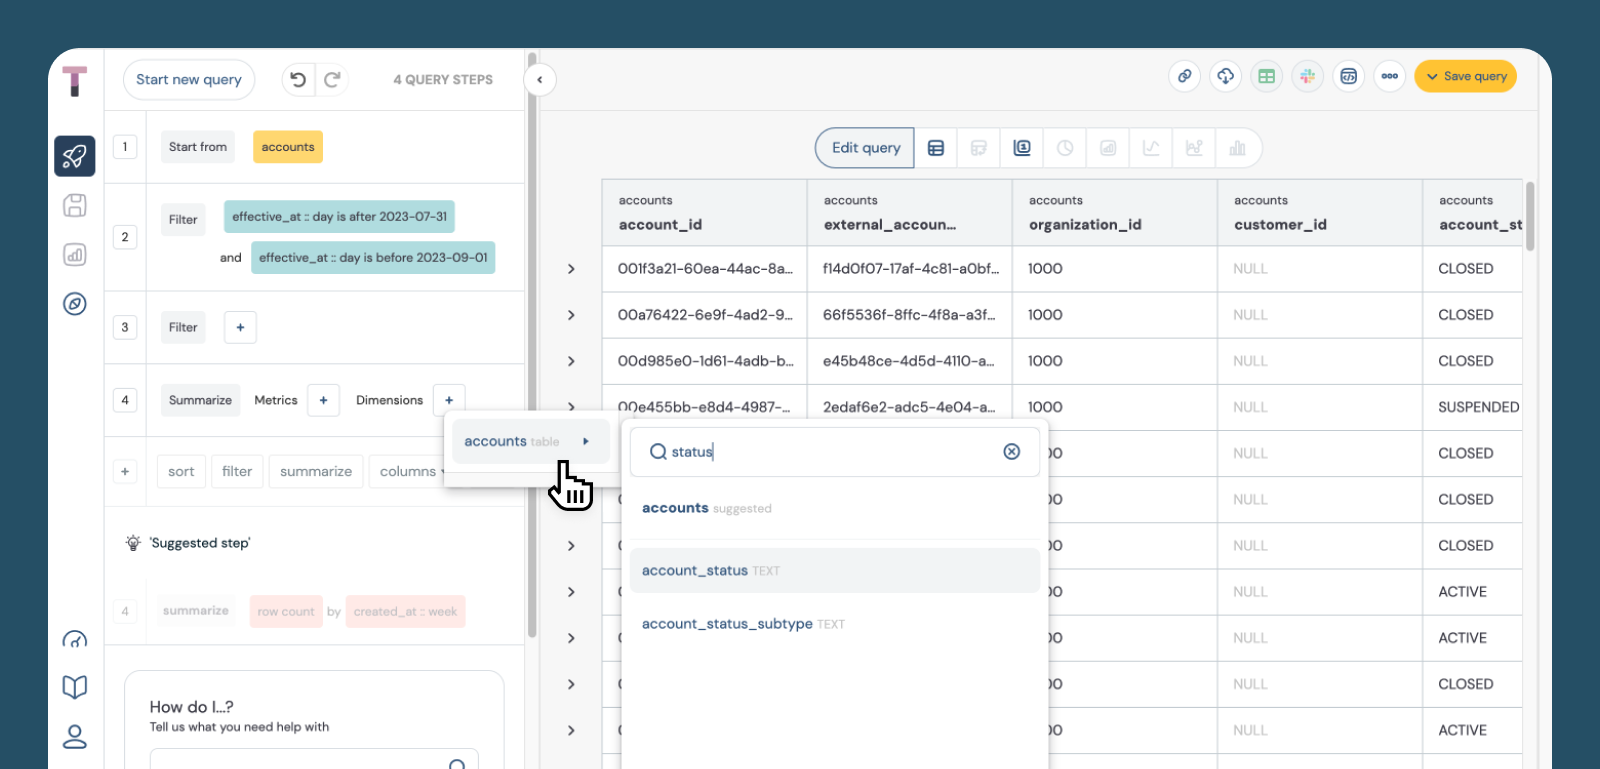
Then we need to choose a Metric [i.e. a mathematical operation to perform on the table]. In our case, we need a number of rows within each Status/ Sub-status group. Hence, let's choose the Count operation.
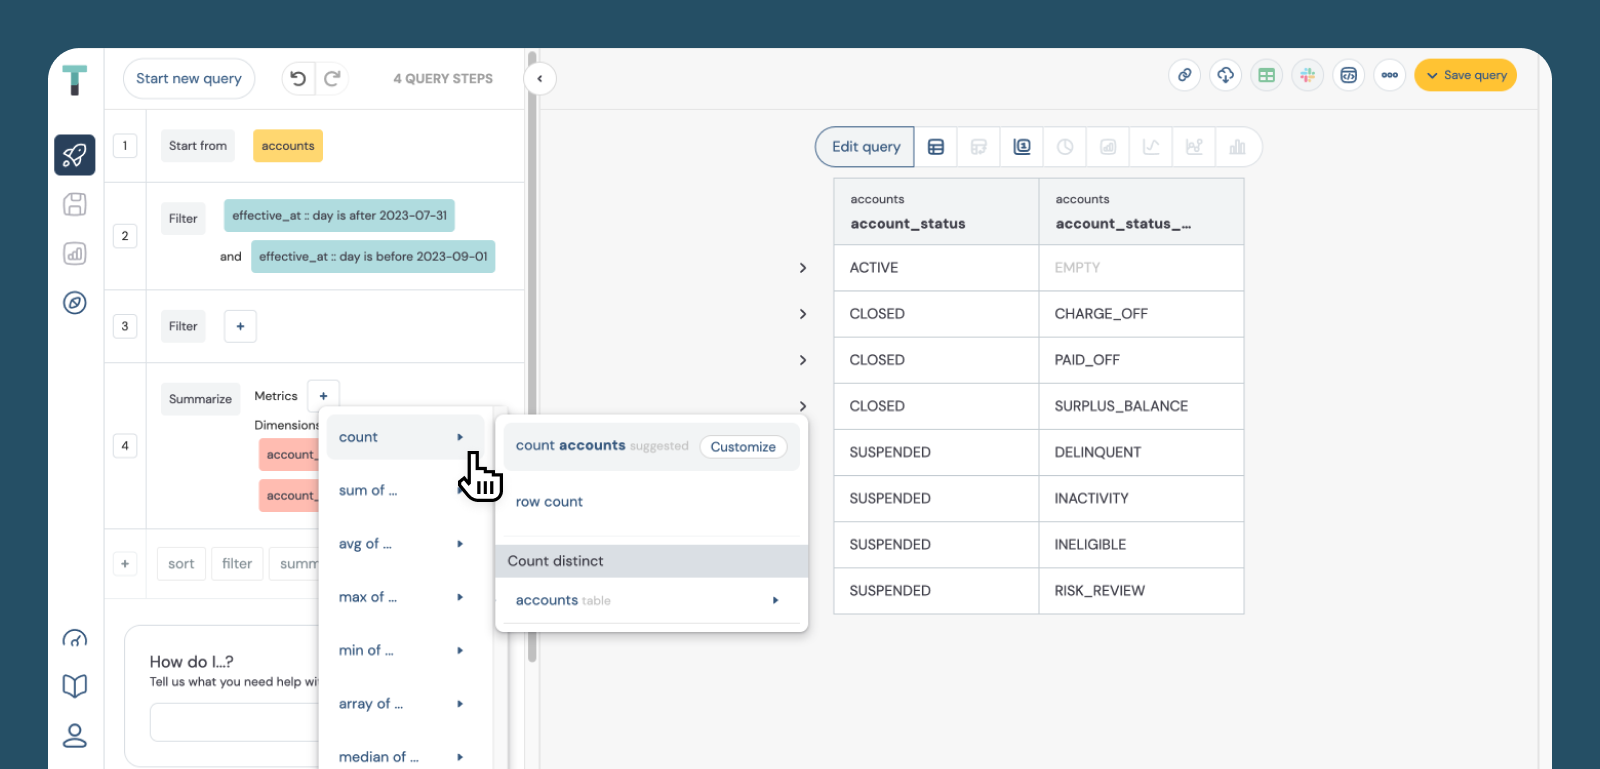
Conveniently, Trevor suggests the right variable.
Thus, we get an answer to our business question: "How many accounts created in August 2023 are there for each status type?"
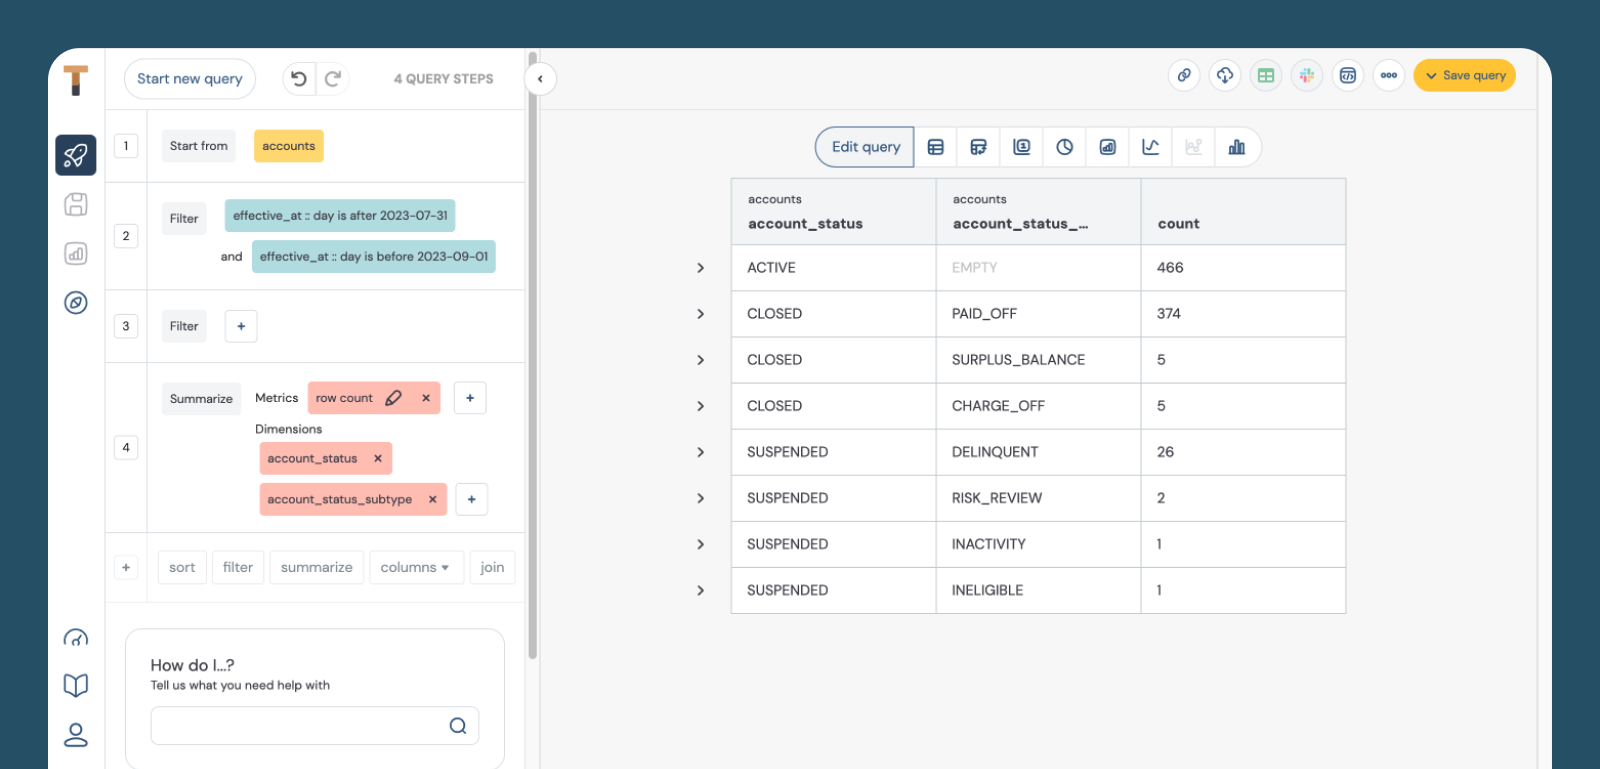
Your first report is complete!Now, hit Save query
Visualize your result
As a cherry on the top, you can also present the stats in a more digestible way.
See the toolbox above the result table in the screenshot below.
You are then able to refine your graph for the best presentation.

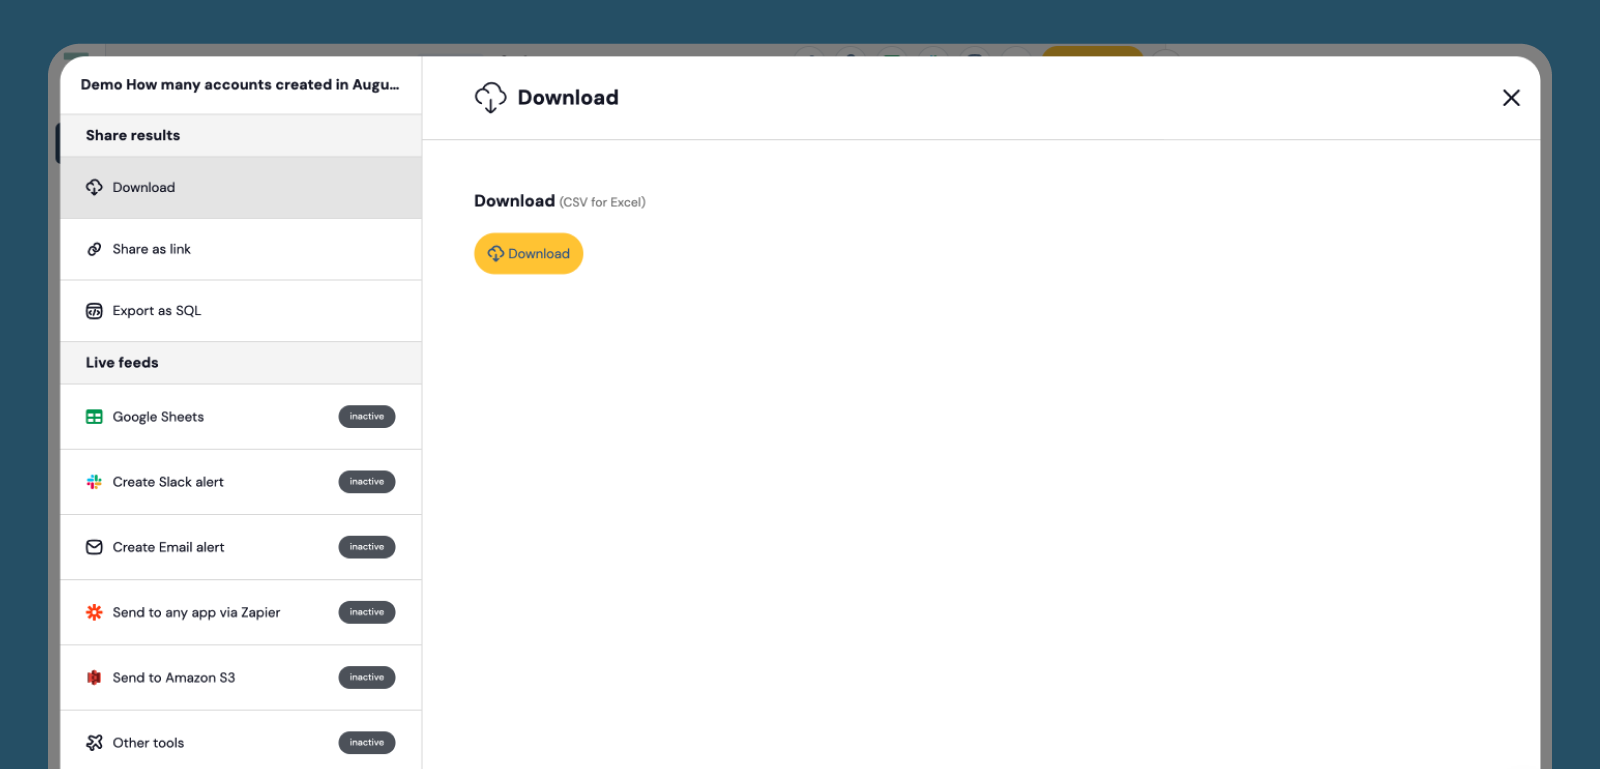
Share your report
Another useful feature is the myriad of sharing capabilities.
Would like to share your table result with Excel natives? Download it as a CSV
Want to get your analyst to refine the query? Share a link to collaborate
Interested in saving a report in your data lake/ warehouse? Export as SQL
and more.
Updated about 1 year ago